Guides
Vending machine performance indicators worth a monthly review, explained
Vending KPIs to track monthly, each with its definition, the threshold that should change what you do, and the thing the number cannot tell you.
What to take away
- Six measures are enough for a small route. Tracking twenty means acting on none.
- Every measure needs a threshold decided in advance, or it is just a number in a spreadsheet.
- Each of these has a blind spot. Knowing it is what stops a confident wrong decision.
- Take them per machine, not as a route average. Averages hide the sites you need to find.
Sales per machine per day
Definition: total sales at that machine divided by the days in the period.
Sales per machine per day
Total sales ÷ days in period
Below threshold: every service trip loses money
Blind spot: says nothing about margin
Pair with contribution per vend
Threshold: the point at which vends multiplied by contribution per vend stops covering the cost of a service visit. Below it, the machine loses money on every trip regardless of what the sales figure looks like.
Blind spot: it says nothing about margin. A machine selling a large volume of low contribution items can outrank a machine selling less of something better. Pair it with contribution rather than reading it alone.
Contribution per vend
Definition: price, less delivered cost, less commission on that price, less the payment cost on that transaction. Blend cash and card by the share of each.
Contribution per vend build-up
- Price
- Less delivered cost
- Less commission on price
- Less payment cost per transaction
- Blend cash and card by share
Threshold: below the level at which a machine's expected vends cover its visit, the answer is a price change, a mix change, a longer interval or a different site.
Blind spot: it is a per item figure and it ignores everything that attaches to the route rather than the vend. Vehicle, insurance, storage and your own time all sit above it.
Sell out rate at the peak
Definition: the share of selections empty at the building's busy hour, measured at the peak rather than at a convenient time.
Threshold: any repeated sell out of a fast selection is a breach. That is demand that arrived and left, and it repeats every cycle until somebody notices.
Blind spot: it measures availability, not demand. It cannot see the person who wanted something you have never stocked, which is why asking hosts what people request stays part of the job. Feeding that answer back into the par levels and mix is where the measure becomes useful.
Days out of service
Definition: days in the period when a machine was not fully working, taken from the fault log.
Threshold: exceeding the response time you promised the host is a failure whether or not anybody complained.
Blind spot: it depends entirely on detection. On a route without telemetry, the figure is bounded by your service interval and flatters you, because you cannot count what you never knew about. Track how each fault was detected alongside the number.
Cost per service visit
Definition: route time, labor and vehicle cost for a run, divided by the stops made.
Threshold: watch the direction rather than the level. A rising cost per stop means the route is spreading out, which is the earliest signal that growth is outrunning density.
Blind spot: it averages a ten minute stop with a forty minute one. If it starts moving, look at visit duration per site rather than the route figure, because one difficult site can move the average on its own.
Shrink by reason
Definition: units removed, split into expired, damaged, mechanical loss and unexplained.
Threshold: unexplained loss that is growing, or that is concentrated at one site, is the one that needs attention this month rather than next quarter.
Blind spot: it only exists if the reason is recorded at the machine. A single shrink total is unactionable, because the four causes need four different responses.
Taking them without a system
None of this requires software. A count sheet per machine and a spreadsheet will produce all six, and the discipline of counting matters more than the tool.
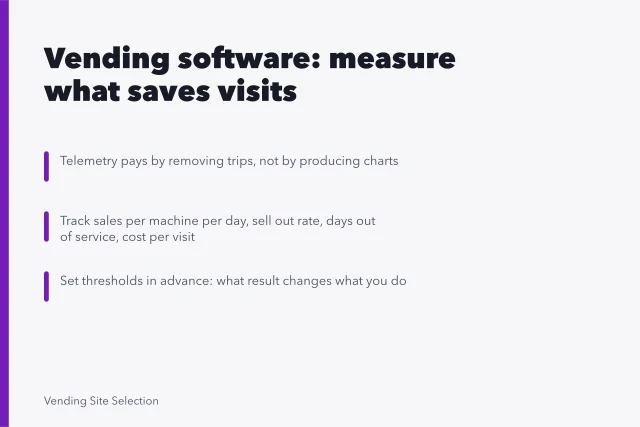
Software lets you take sales figures without opening the machine. That makes the sell out measure cheaper to collect and shortens fault detection.
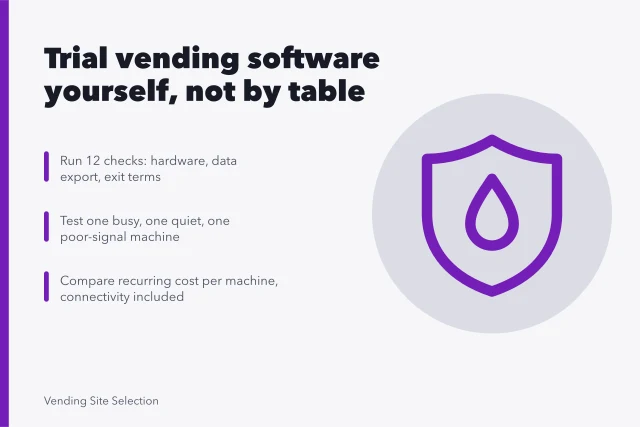
Whether it pays is arithmetic you can run: compare its per machine cost against trips avoided and downtime shortened. The evaluation approach covers what to check before committing to a platform.
Wherever the numbers live, protect access to them. Use individual accounts, remove them when someone leaves, and turn on any additional verification available.
The National Institute of Standards and Technology: NIST Small Business Quick-Start Guides and Cybersecurity and Infrastructure Security Agency: Cyber Guidance for Small Businesses pages both set this out for businesses with no IT function.
The monthly half hour
Set a fixed time and look at the six together. Four questions get you through it.
- Which machines are below the threshold on sales per day, and what is the plan for each?
- Which machines sold out at the peak, and is that pars or interval?
- Which faults ran past the promised response time, and how were they detected?
- Where is unexplained shrink, and is it following a site or a person?
Write down what you decided, not just what you observed. A review that produces no decision produces no change, and the numbers keep drifting.
Records make this possible and are expected of you. Sales, purchases, expenses and inventory fall under the Internal Revenue Service: What kind of records should I keep? guidance.
If you are still placing your first machines, start the count sheet with the first one. Retrofitting the habit onto a growing route is much harder. It matters more when machines sit further from home and you see them less often.
Common questions
Is there an industry benchmark I should compare against?
Any benchmark averages operators with different commission rates, prices, drive times and site mixes, which makes it useless for deciding anything about your route. Your own trend over months answers the question the benchmark is standing in for.
Should I track sales per selection as well?
Yes, at the machine level, because that is what sets par levels. It is not a monthly review measure so much as a working record you consult when changing the mix.
How many months before the numbers mean anything?
Three cycles gives you a usable figure for a machine and a poor sense of trend. Six months of monthly reviews is where the pattern becomes something you can act on with confidence.