Guides
Route density in Houston, Atlanta and Phoenix, lessons for sprawling metros
Route density in Houston, Atlanta and Phoenix follows drive time, not zip code, so cluster borders and leg limits differ from compact East Coast routes.
What to take away
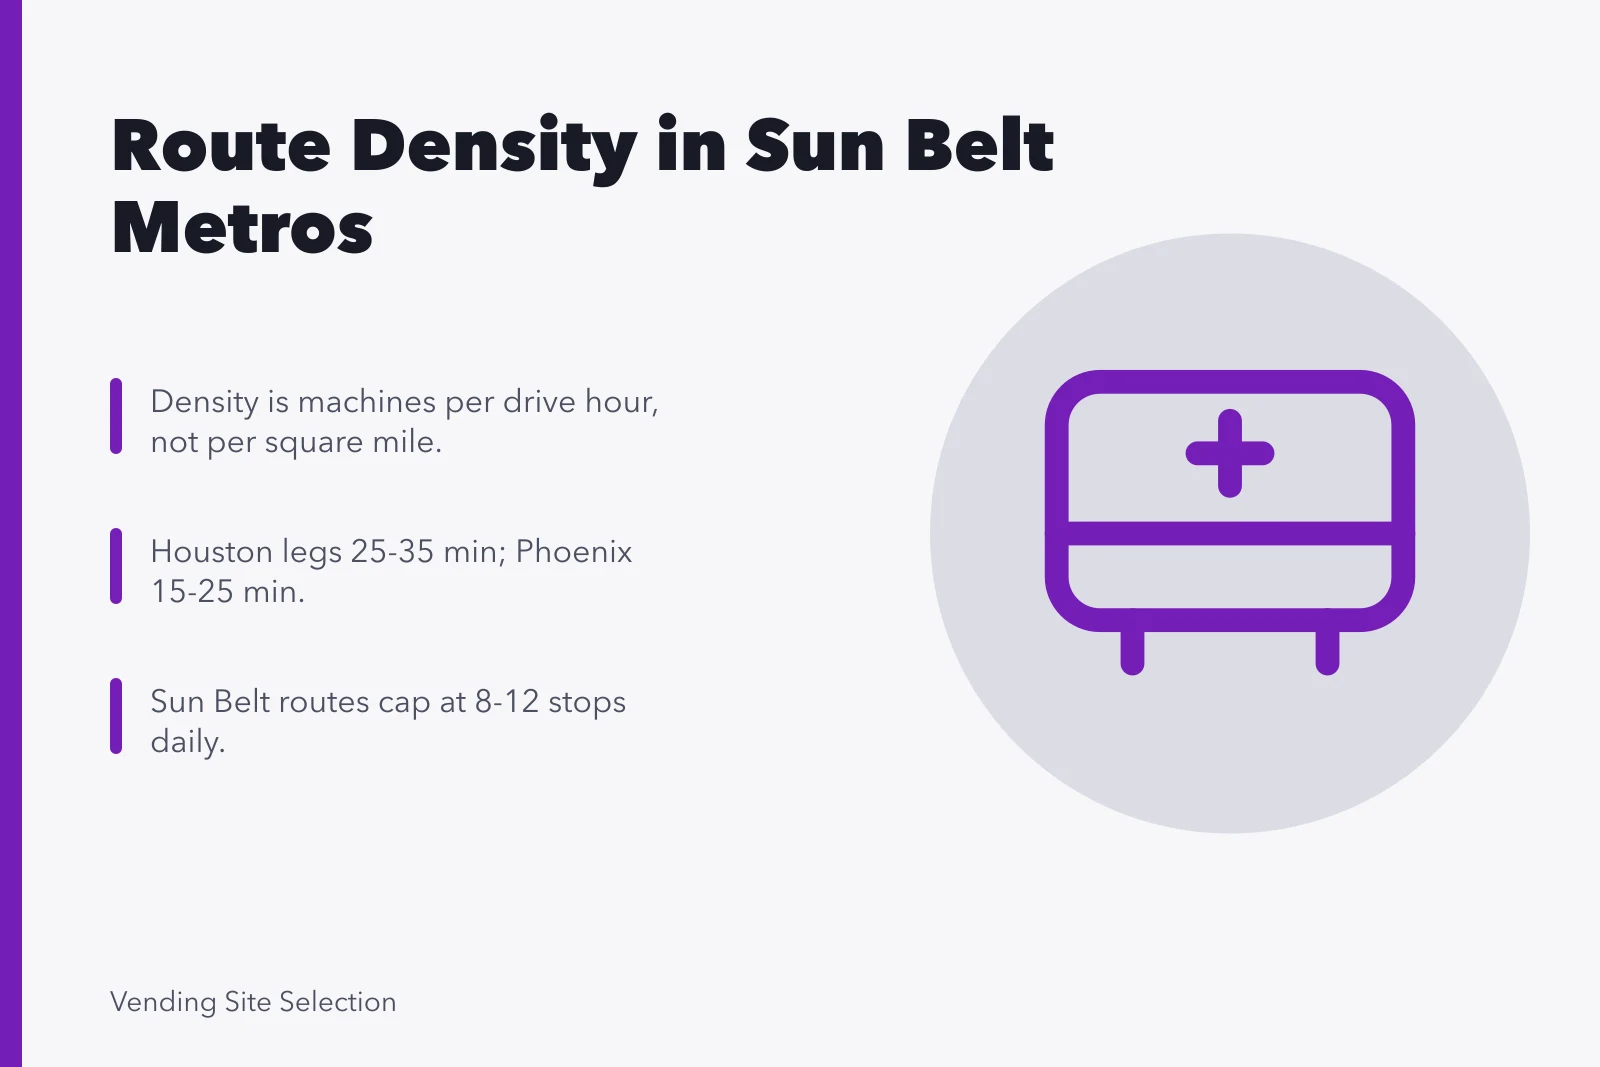
- Density is machines per drive hour, not machines per square mile.
- Houston legs run 25 to 35 minutes, Atlanta legs follow highway corridors, Phoenix legs run 15 to 25 minutes on the grid.
- A compact East Coast route serves 12 to 15 stops a day. Sun Belt routes cap near 8 to 12.
- A leg over 45 minutes pays only when the stop is a high-volume anchor.
- Rebuild clusters quarterly from logged drive time and service minutes.
Why Sun Belt sprawl breaks East Coast route assumptions
An operator trained in Philadelphia or Boston treats a route as a tight loop. Run the same stop count in Houston, Atlanta or Phoenix and the drive time can triple. Fuel, labor and service windows all move with it.
The three metros sprawl differently. Houston has no natural edge. Atlanta stretches along job corridors and highways. Phoenix sits on a grid. Each pattern needs its own clustering rule, and one rule for all three will fail in at least two.
Federal data shows where the stops are. The Bureau of Labor Statistics publishes regional labor data that ranks metros by employment concentration, which is where vending demand collects.
An office, warehouse and hospital base beats a retirement or tourism base. The Quarterly Census of Employment and Wages gives that picture by metro.
Compare markets on employment concentration, not population. A metro of millions with scattered jobs produces weak density. Geographic statistics by metro let you rank one against another on that basis.
Long drives also mean more highway hours and more lifting away from the shop. Workplace injury data shapes how you set night stops and load limits.
When routes already slip, the plan is usually the cause rather than driver effort. A method to schedule vending machine routes starts from drive time, not stop count.
Route density math in Houston, Atlanta and Phoenix
Density is machines divided by drive hours. Twenty machines over six drive hours is 3.3. Twelve machines over two drive hours is 6. The second route wins on fewer stops.
Route density by metro
Houston
- Stops per day
- 8 to 10
- Drive hours
- 4.5 to 5.5
- Density target
- 2.0+
Atlanta
- Stops per day
- 8 to 11
- Drive hours
- 4.0 to 5.0
- Density target
- 2.2+
Phoenix
- Stops per day
- 10 to 12
- Drive hours
- 3.5 to 4.5
- Density target
- 2.5+
East Coast
- Stops per day
- 12 to 15
- Drive hours
- 2.5 to 3.5
- Density target
- 4.0+
Houston drive hours swell because the metro holds several job centers at once: downtown, the Energy Corridor, the Galleria, the Medical Center and the ship channel. A route touching three of them spends the day on Loop 610 and I-10.
Atlanta drive hours swell from congestion as much as distance. A 20 mile leg on I-285 at 4 p.m. can run an hour. Density there depends on the clock as much as the map.
Phoenix drive hours are steadier. The grid holds speeds even, but Chandler to Peoria is a long haul at any hour. Density depends on how tightly you cluster along the grid.
Run the comparison below with your own logged numbers.
Route density math
| Metro | Stops per day | Drive hours | Density target (machines per drive hour) |
|---|---|---|---|
| Houston | 8 to 10 | 4.5 to 5.5 | 2.0 or higher |
| Atlanta | 8 to 11 | 4.0 to 5.0 | 2.2 or higher |
| Phoenix | 10 to 12 | 3.5 to 4.5 | 2.5 or higher |
| Compact East Coast city | 12 to 15 | 2.5 to 3.5 | 4.0 or higher |
These are planning ranges. Your stop-level data will shift them.
Worked example, Houston west side. Ten stops hold 14 machines: four in the Energy Corridor, three in the Galleria and three along Beltway 8.
Drive time runs about 5 hours: 3 hours between stops, 1.5 hours from the shop and back, 0.5 hour for a reload. Density is 14 divided by 5, which is 2.8 machines per drive hour. Two extra machines in buildings the route already serves raise density to 3.2 with no added driving.
High density is easier to staff, easier to cover on a call-out and easier to grow. Low density looks busy and pays little.
Drive-time rules for each metro's road network
Write the drive-time rule per metro. The road networks differ enough that a shared rule breaks somewhere.
Drive-time rules by metro
Houston
- Cluster around
- Employment hubs
- Leg time
- 25 to 35 min
- Borders
- Grand Parkway, Beltway 8
- Avoid
- Crossing two freeways
Atlanta
- Cluster around
- Highway corridors
- Leg time
- Under 30 off-peak
- Borders
- I-285, I-85, I-75, GA 400
- Avoid
- Crossing a corridor
Phoenix
- Cluster around
- Grid blocks
- Leg time
- 15 to 25 min
- Borders
- I-10, Loop 101, Loop 202, US 60
- Avoid
- Long diagonal hauls
Houston: cluster around employment hubs and treat each hub as a mini-route. A driver serves one hub and its ring, then returns. Keep legs between 25 and 35 minutes, and do not cross two freeways in one leg. Use the Grand Parkway and Beltway 8 as outer boundaries, not daily crossings.
Atlanta: cluster along corridors rather than around points. I-285, I-85, I-75 and GA 400 form natural bands. Keep a driver on one side of a corridor per trip, and put the congested corridor in the early morning or after 7 p.m. Legs run under 30 minutes off-peak and under 45 in peak.
Phoenix: cluster on the grid, using I-10, Loop 101, Loop 202 and US 60 as cluster borders. Keep legs between 15 and 25 minutes. Predictable speeds allow tighter windows and more stops, but the metro's width still sets the outer limit.
All three share one rule: no single leg past 45 minutes unless the stop is a high-volume anchor. An anchor earns back the time; a marginal stop does not.
Put these rules in a written operations and workflow guide so every driver works from the same logic. Without it, drivers improvise and density slides.
A clustering method for sprawling metros
Run this method whenever you add stops or rebuild a route. It fits Houston, Atlanta and Phoenix, and it adapts to other Sun Belt metros.
A clustering method
- Export 90 days of stop dataaddress, sales, service minutes and arrival time.
- Log actual drive minutes between consecutive stops, not map estimates.
- Plot stops on a map and draw the freeway borders you already use: Loop 610 and Beltway 8 in Houston; I-285 in Atlanta; Loop 101 in Phoenix.
- Group stops inside one border into a candidate cluster. Put any stop more than 45 minutes from the cluster center on a separate list.
- Rank clusters by machines per drive hour rather than machine count.
- Place the high-volume anchors first, then fill the remaining drive hours with the nearest stops until the route meets its density target.
- Test the draft on a real weekday. Move or drop any stop whose leg runs past the metro limit.
Quarterly clustering method
- List stops with sales, service minutes, windows
- Draw 20-minute rings around high-volume anchors
- Group stops inside one ring into a cluster
- Check drive hours, service minutes, revenue
- Assign clusters to days without territory overlap
- Run one week and log actual times
- Revise with real times and lock for quarter
The method turns route planning into a quarterly exercise instead of a daily guess, and it gives you a clean way to onboard a new driver.
The same logic prices a new site. A stop inside an existing cluster beats a higher-traffic stop standing alone. Read a site selection and location guide alongside your cluster map, never instead of it.
Track density, revenue per drive hour and service minutes per stop as performance indicators worth a monthly review. Two months of falling density means rebuild the clusters before you add a stop.
Comparing Sun Belt density with compact East Coast cities
Compact East Coast cities allow a different model. In Boston, Philadelphia or Washington, D.C., a driver serves 12 to 15 stops a day because the stops sit close. Parking is the constraint there, not distance.
Sun Belt metros invert that. Strip centers, offices and warehouses offer easy parking, and the driver still loses the day to the road.
The cost structure follows. In a compact city, labor dominates the route cost. In a sprawling metro, labor and vehicle cost rise together, so fuel, tires and maintenance carry more weight.
Machine count per driver moves too. A tight East Coast route can support 80 to 100 machines. A sprawling Sun Belt route often supports 50 to 70. That number measures geography, not effort.
Staffing shifts with it. Short part-time shifts work in a compact city. Sprawling metros need drivers who can handle a full day behind the wheel.
Operators in both regions should keep separate plans and separate density targets. Copying the East Coast plan into the Sun Belt is how routes start slipping.
Staffing and vehicle choices for long-drive routes
Long drives change what you buy and who you hire. A vehicle that works in a compact city may be the wrong one in Houston or Phoenix.
Houston and Phoenix reward a box truck or large van with organized shelving, because it cuts reload trips. Atlanta may only need a mid-size van if clusters stay on one side of a corridor. In all three, a backup vehicle matters: a breakdown on a long route costs more than one in a compact city.
Match the schedule to the drive time. A driver who spends five hours driving has less left for service and troubleshooting. Build in a lunch break and a mid-day reload point, and keep the last stop inside a safe working day.
Safety training carries more weight on long routes. Train on lifting, loading and night stops, and decide when a two-person team is safer than one driver.
Stock common parts in the vehicle, because a failed machine on a far stop can cost the day. If a repair runs past 20 minutes, log it and move on. The mix of locations for vending machines you serve decides which parts earn a permanent spot on the shelf.
Keep a vehicle checklist for each route day.
- Fuel at three quarters or more at start
- Bill validators, coin mechs, motors and fuses stocked
- Hand truck and straps secured
- Route sheet with drive-time rules attached
- Phone charged and route app updated
- Backup plan for the highest-volume anchor stop
Building a route plan you can revise quarterly
A route plan decays as sites open, close and traffic shifts. Review it every quarter against real data.
Start with stop-level sales and service minutes. Drop or relocate any stop below your density threshold for two quarters. Add stops inside existing clusters unless a new anchor justifies a new cluster.
Check drive times against the metro rules in the same review. Houston legs creeping past 35 minutes mean split the cluster. Atlanta peak legs past 45 minutes mean move that cluster to an off-peak daypart. Phoenix legs past 25 minutes mean tighten the grid borders.
Hold the plan to a density target per metro. When density falls, fix the plan before hiring. Another driver on a low-density route hides the problem and raises cost.
Document the plan so any driver can run any route. Written logic also makes a route easier to sell or hand off later.
The operators who win in Sun Belt metros are not the ones with the most machines. They are the ones who know their drive hours, their density and their cluster borders, and who revise the plan before the market forces it.
Common questions
How many stops should a Houston vending route have?
Most Houston routes run 8 to 10 stops a day because drive time between job centers is long. Stops inside a single hub support more.
Is Atlanta route density hurt more by traffic or distance?
Traffic is the larger factor. A short leg on I-285 at peak can outlast a longer off-peak leg, so congested corridors belong outside peak hours.
Can I use the same clustering method in all three metros?
The seven steps are the same, but the drive-time rules differ. Houston clusters around hubs, Atlanta along corridors and Phoenix on the grid.
How often should I rebuild the route plan?
Quarterly, using actual drive time and service minutes. Monthly density and revenue-per-drive-hour reviews tell you when a mid-quarter fix is due.